3D Scanning and Deviation Analysis Accelerates Inspection
What is Deviation Analysis?
Deviation analysis is a proven method for assessing the accuracy and quality of diverse physical objects, from small mechanical parts to sky-scraper-sized structures; from automobiles to airplanes; and nearly anything else that requires precision fabrication.
In statistics, deviation analysis is defined as a measurement of the absolute difference between any one number in a set and the mean of the set. This measurement process can be applied to any number of applications, from deviation analysis of social strata to deviation analysis in engineering applications. It is the latter that this article discusses.
When deviation analysis is used for inspection purposes, 3D scan data is captured using a laser scanner. Depending on the reason that the inspection is being done, the scanned data may be compared to existing CAD drawings or to previously scanned scan data.

For instance, if the inspection is performed is a Quality Control (QC) inspection of new parts coming off the assembly line, then the scanned data would be compared to the CAD files or 3D models used to fabricate the parts. If the inspection is being done to determine the rate of wear on an in-service part or the rate of deterioration in a structure, then the 3D scan would likely be compared to previous 3D scans made of the part or structure.
This process is also called Computer-Aided Verification (CAV) or Computer-Aided Inspection (CAI), and the output of the process is often called a color map because of its bright, colorful visualizations. These colormap deviation coupled with analysis reports generally provide sufficient data to update a manufacturing process or correct structural defects.
Steps Used for Deviation Analysis
- Use a 3D laser scanner to digitize the physical part. Scanning enables the collection of millions of points over the surface of the part, which can be compiled into a point cloud. our in-house technologies can be used to gather the point cloud data necessary to compute the analysis. We typically collect in excess of 1,000,000 data points all over the surface of the part, top, and bottom (core and cavity).
- The point cloud data is aligned with an existing CAD model, or previously scanned data in such a way as to provide the best fit for comparison. Best fit, also called a standard datum alignment is the typical comparison method, but nearly any type of comparison is possible.
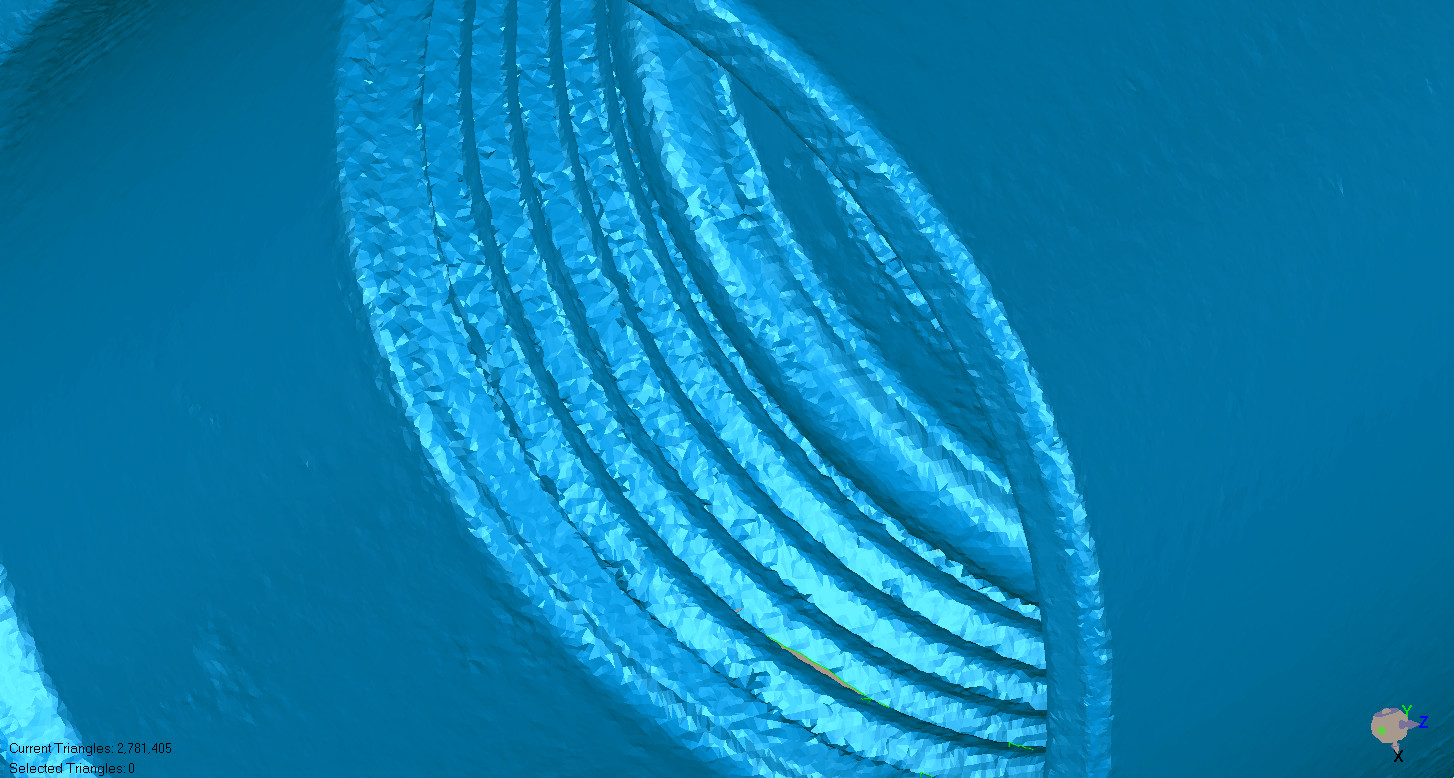
- Specialized software is used to compute the distance from each of the million+ points to its closest surface. It then colors the area of the surface under that point a color that corresponds to the magnitude of the deviation. Red colors normally indicate plus material and blue tones indicate a lack of material.
Examples of Deviation Analysis using SOLIDWORKS
Checking the symmetry of a part requires the measurement and inspection of complex surfaces and raises a number of challenges both in terms of the equipment used and the measurement strategy. Verifying the symmetry allows the identification of the asymmetrical areas regarding critical elements.
Using a laser scanner, the part is scanned and the resulting point cloud is imported into SolidWorks.
The Deviation Analysis tool in SOLIDWORKS is a diagnostic tool that calculates the angle between faces. You can select a single edge or a series of edges. The edges can be between faces on a surface or any edges on a solid.
Deviation Analysis Using CATIA
A Google search for deviation analysis using CATIA offers a tutorial on Generative Part Structural Analysis showing CATIA’s Stress Analysis tool, which they say is easy to use – even for the non-analyst, and that it gives accurate results.
Using a Deviation Analysis Service
Sometimes manufacturing and design firms opt to outsource their 3D scanning, point cloud conversion eviction analysis. If you need a color map to visually identify sink, warp, twist, and other undesirable characteristics, without the hassle of doing it yourself, this may be an alternative to look into.
Recent Posts

Tips for Picking the Perfect 3D CAD Viewer for Your Needs
This guide will teach you about 3D CAD viewers and outline considerations to make before picking the right one. We review 5 options and pick a clear winner.

In this guide, you’ll learn how CAD/CAM Services can save you time and money during each digitization project. Digitization can make manufacturing faster than ever before.
How to Build an Aircraft Model by Converting 3D-Scanned STL Files into Functional 3D STEP Files
This in-depth guide will teach engineers how to use 3D-scanned aircraft files and transform them into manufacturable 3D STEP files with fewer mistakes.